Welcome to the biyearly Market Watch. Usually, I do this in July and December, but the market has had such a noticeable change in the last month that I decided to bring it forward. This is because someone pushed the green light, and people’s attention suddenly turned to real estate. We humans have a herd mentality, often on display in property and the share market.
Yes, springtime is often the season when we have more listings and more buyers searching. Families who are moving want to have the kids settled in a school by January. We have had three interest rate cuts, placing us in a downward rate cycle. However, today’s announcement by the RBA will be a “Hold”.
Additionally, there is the federal government’s 5% deposit First Home Owner Support Scheme. These schemes are window dressing for a government to appear as though it is taking action. They do help a few people (approximately 10,000 per year), however in reality, they do the opposite of what is required – increasing the median price of entry-level property, making it harder for many others to get in.
National Trend
I have no memory of a market turning so quickly from lukewarm to strong in such a short amount of time. All eight capital cities recorded strong quarterly growth this September. Brisbane and Canberra are now number 2 and 3 on the median house price ladder. Melbourne is not in decline; instead, it is taking the right approach by building more density, which manages to temper price rises.
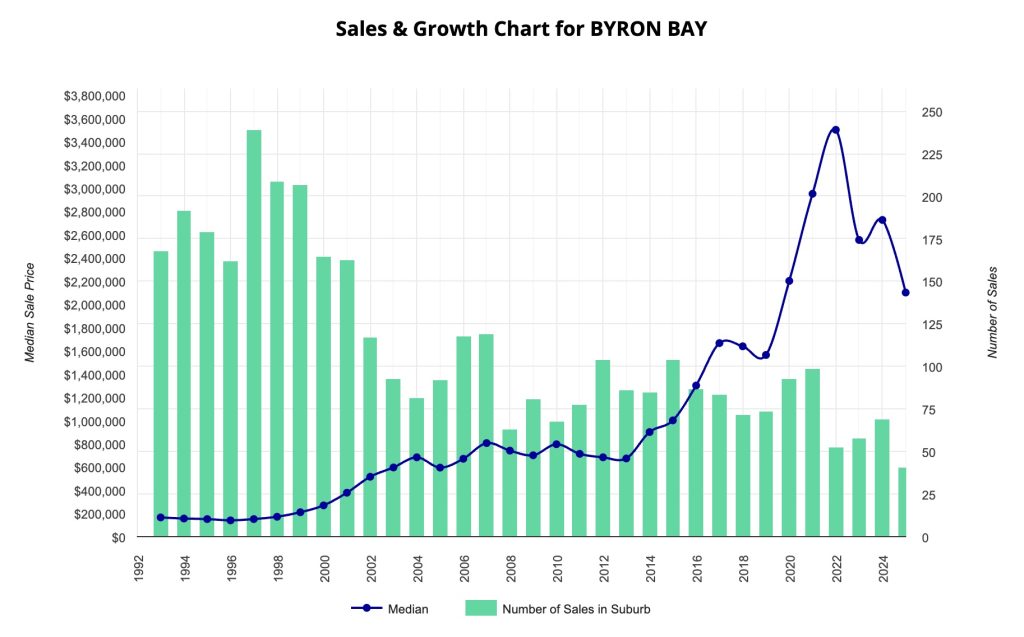
Sydney’s median house price is now $1,750,000, an increase of 3.4% this quarter alone, and the fastest quarterly growth in two years. Byron Bay 2481 is now at just over $2 million and has had a higher median price than Greater Sydney since 2018. Of course, many individual Sydney postcodes have a higher median price than Byron Bay. Bellevue Hill is now the highest at over $10 million, and Palm Beach is over $5 million.
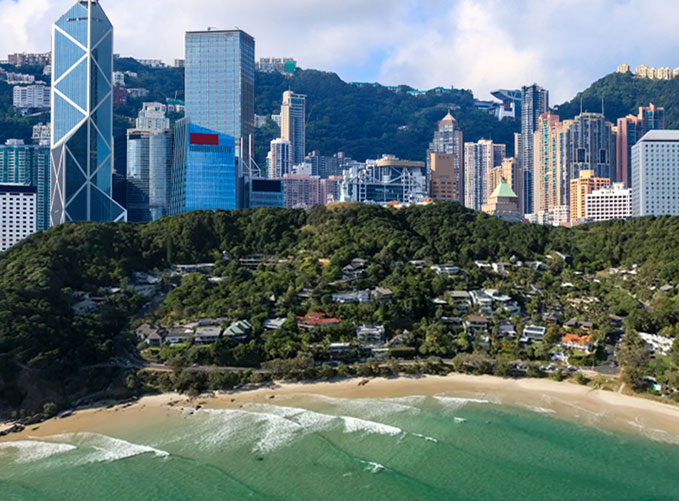
Globally, only Hong Kong has higher property prices than Sydney. This is nothing to be happy about, especially after viewing this viral video of people lining up to view a rental in Sydney. One could expect the trend line in the graphic below to show a levelling, and/or an upswing if supply remains tight.
Fewer listings, more demand
Unfortunately, I am unable to measure the number of listings shire-wide, only by postcode. It seems that there are fewer listings in Byron Bay 2481 than in the same period last year and 2023. 43 now, 66 last year, and 77 in 2023. Both Mullumbimby and Ocean Shores currently have more listings than they did last year, and Bangalow remains steady.
If supply is tight and listings are scarce, the market shifts from a buyer’s market (where there are more sellers than buyers) to a seller’s market (where there are more buyers than sellers). Then we will see FOMO, where the fear of missing out prompts people to pay more, creating a domino effect. We will quickly see prices increase if supply is tight and there is a shortage of listings.
Predicting the curve
As they say, the best time to plant a tree is yesterday. Maybe the time to buy in Byron Shire is tomorrow. We may be at the bottom of the S-curve and emerging from a soft market. I do not see a surge of stock coming to listing, and pundits are saying the share market is in bubble territory. We may be entering a robust property market in the whole shire.